Welcome to our quick start guide, it explains the basics of the Smart Trackers application. You can find more detailed information in the manual section.
Some of the images may appear small, please click on them to load a bigger version.
Index
- Filtering gauges
- Adding data to gauges
- Adding a document as evidence
- Approving measurements
- Creating a chart on your dashboard
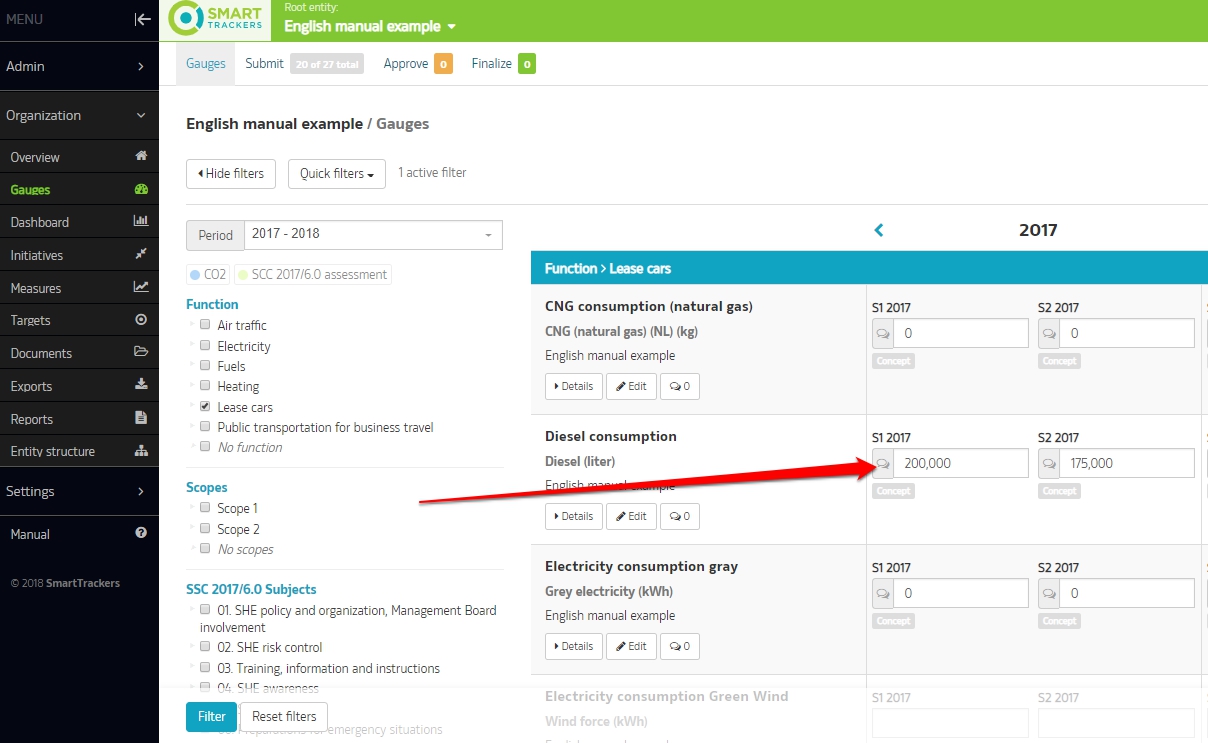
1. Filtering gauges
Go to the tab [gauges] in the left menu bar:
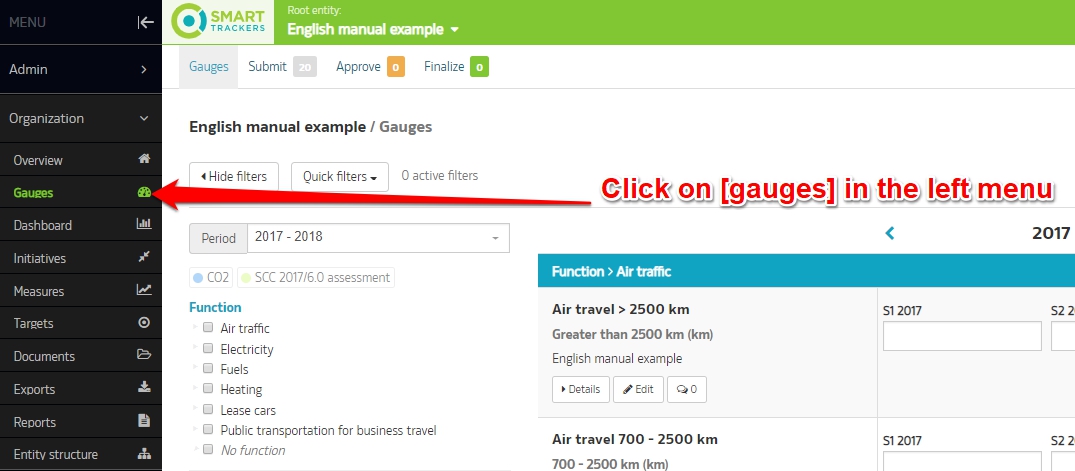
You will see all the gauges that are added to your CO2 bookkeeping. Use the filter option to find the gauge you want to work with.
Select one or more of the checkboxes to filter under "function” on the left part of the page:
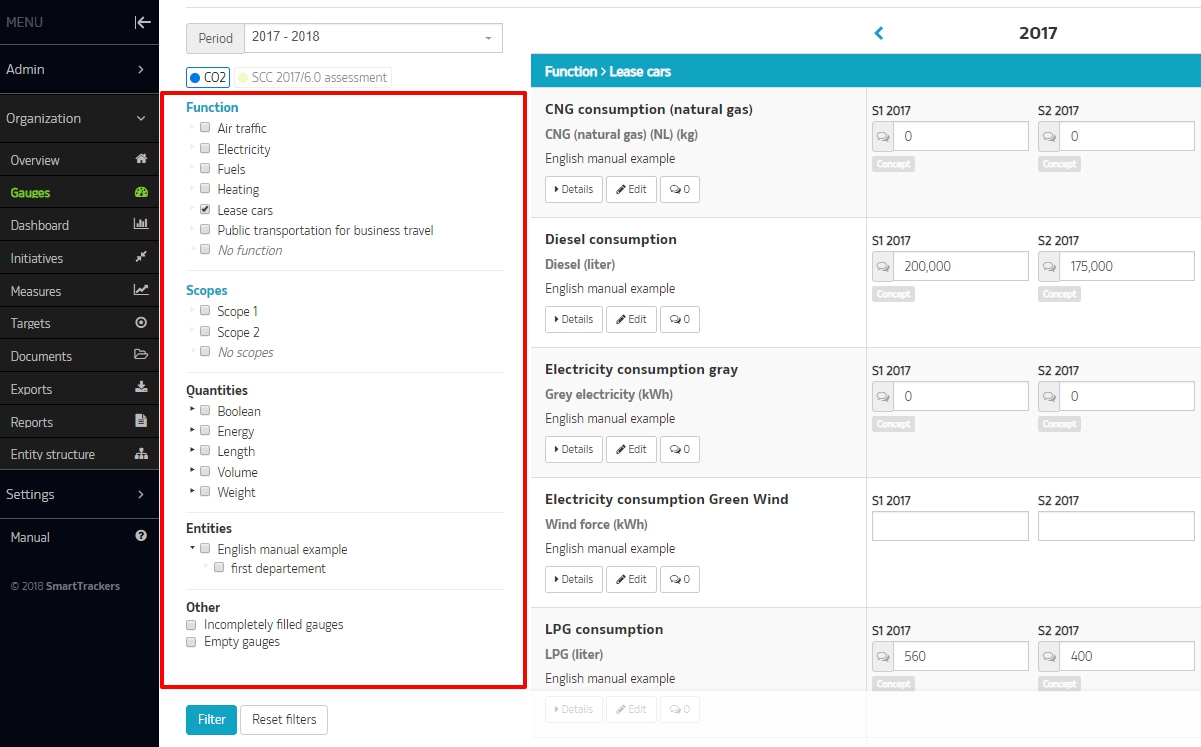
After you have made a selection you click on [filter] on the bottom of the page. You will only see the desired gauges. It is possible to filter on a function like above, but you can also filter on scope or quantity. For a selection of gauges that still need to be filled, filter on empty gauges.
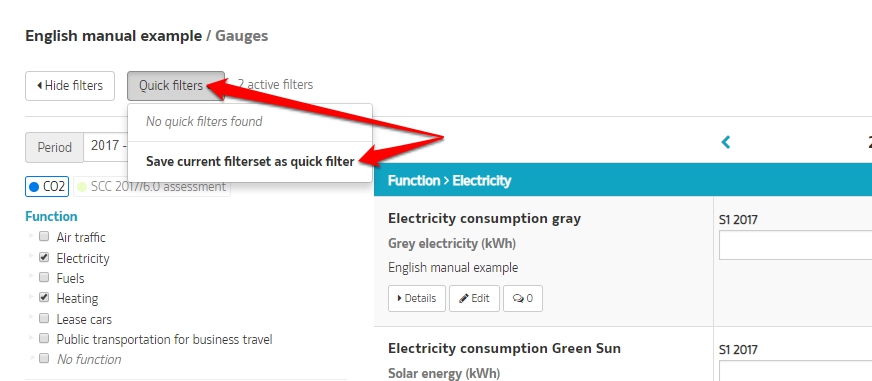
You can save your selection of filters as a 'quick filter':
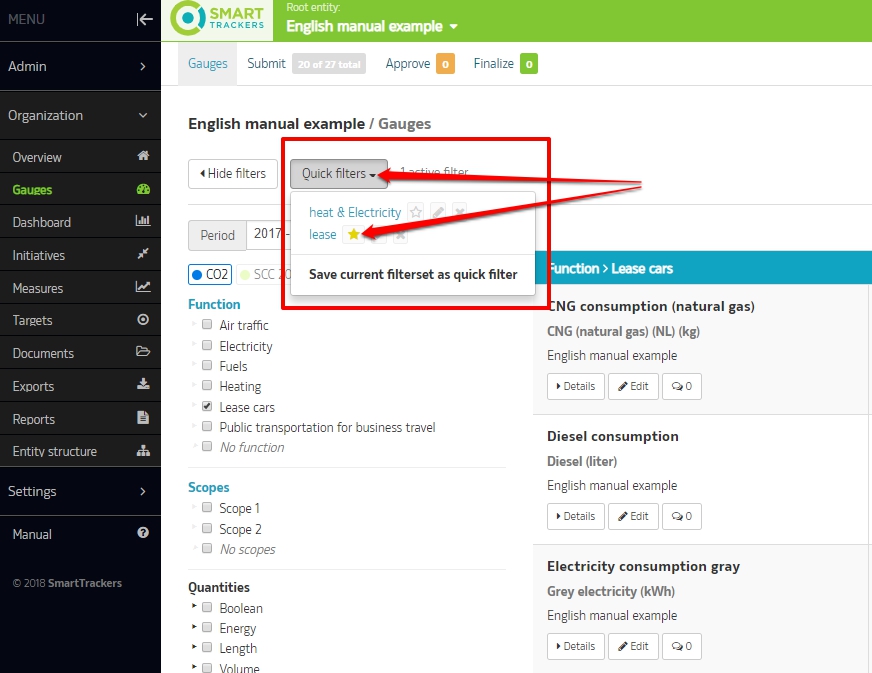
Multiple quick filters can be saved as shown below. To set one of them as the default filter click the star on the left of the filters name. The set of filters will be opened each time you open the gauge page.
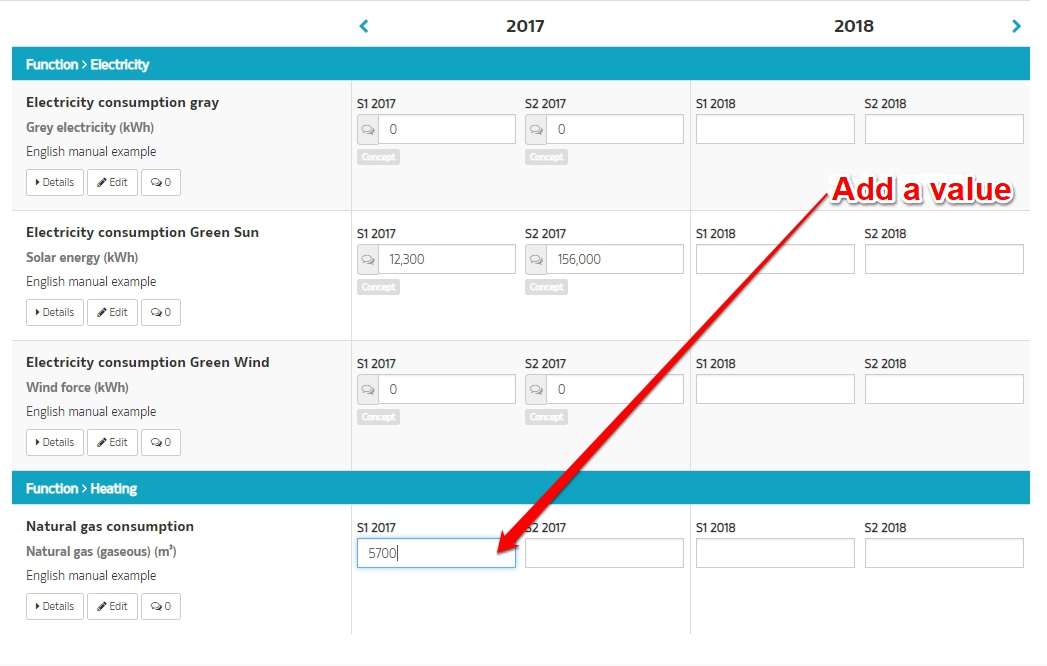
2. Add data to gauges
To add data to the gauges simply click on the input box belonging to the gauge you want to fill and enter a value. When adding data the values will automatically submit.
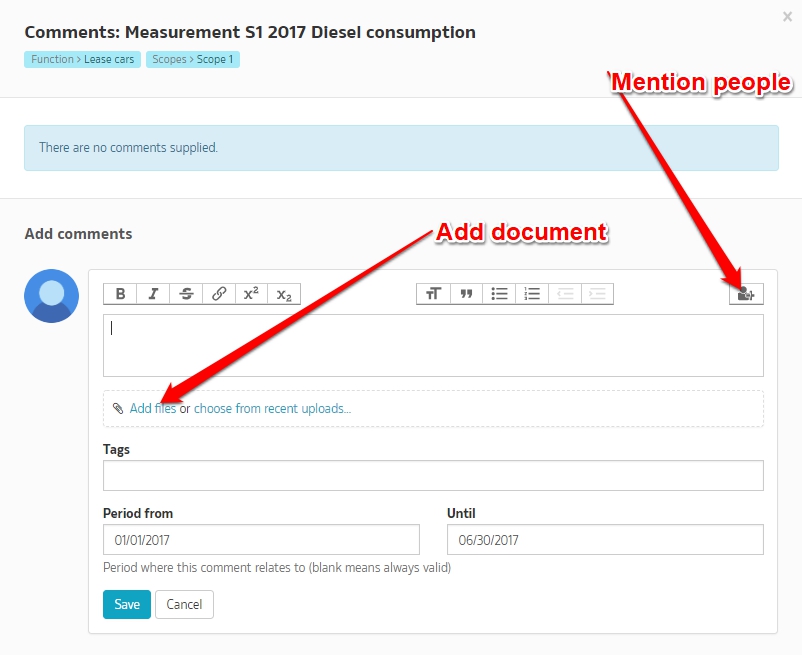
3. Add a document as evidence
To create a clean, complete and transparent bookkeeping you need to add evidence to the measurements. You can do this by clicking on the speech bubble that appears when you add a measurement.
A comment box will appear specifically for this measurement. You can add people who may be interested in an update and attach a document, so in the future it will be clear where the data came from.
4. Approve measurements
After all the measurements are filled and the evidence is added, the administrator of your organization will receive a message and can approve the measurements.
To submit the measurements; go to the tab “Submit” in the top left corner. This shows all the gauges that have not been submitted. See the red border box in the picture below.
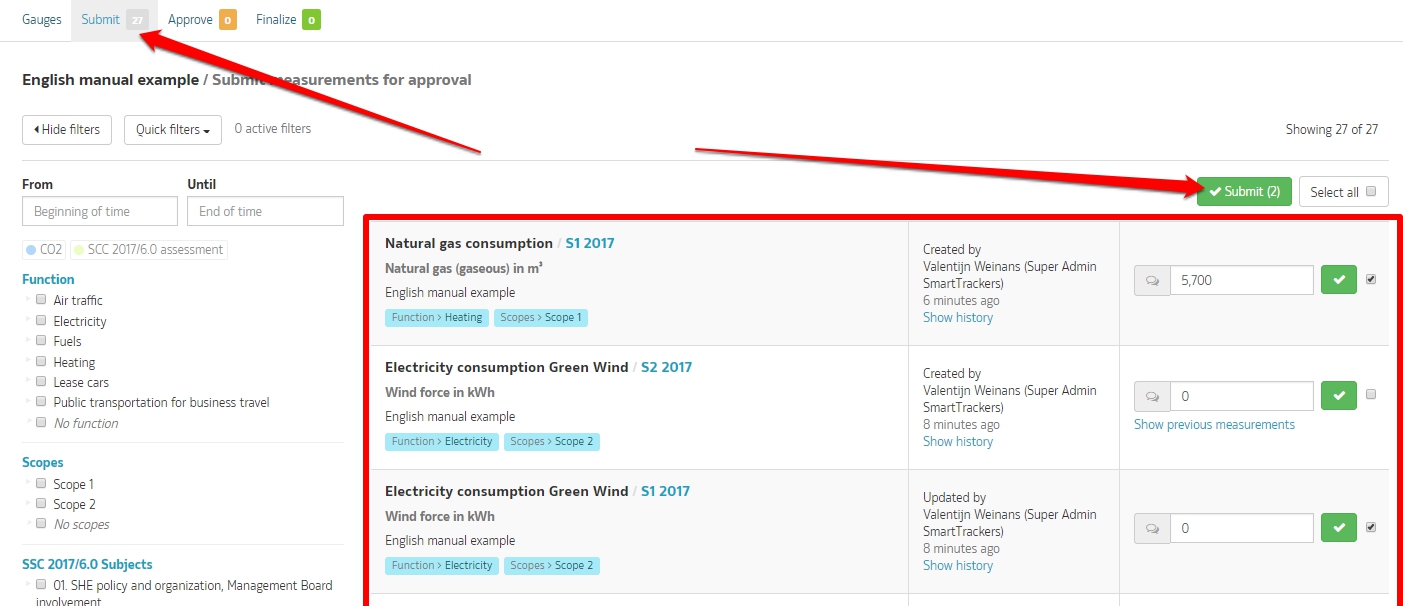
Check the boxes on the right of the measurements you would like to approve and click the green [submit] button on the top right.
All the selected measurements are now submitted.
5. Create a chart on your dashboard
You can visualise your data in charts. Click on “Dashboard” on the left menu bar.
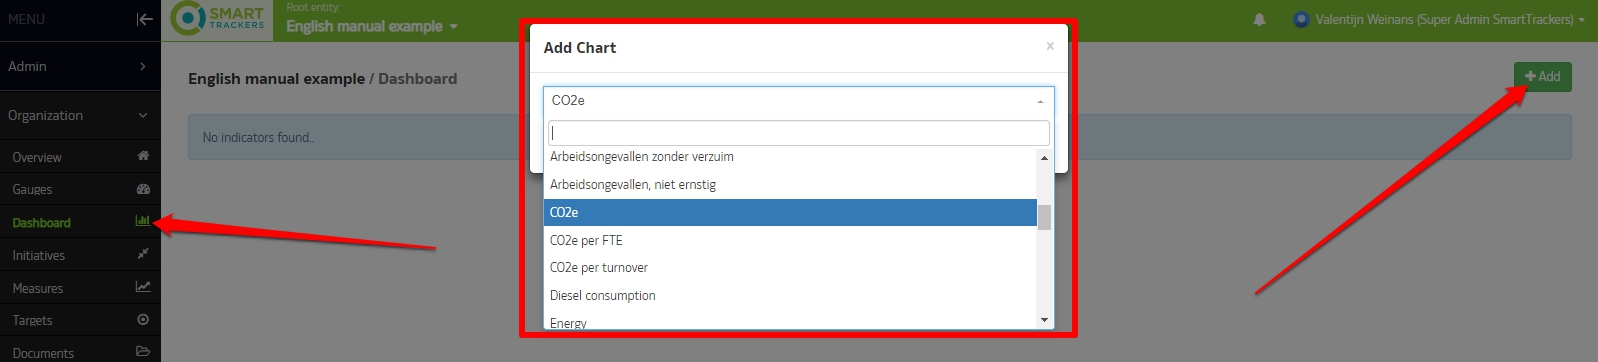
Add an element on the dashboard by clicking on the green button [+Add] in the top right corner. This will show a new pop-up box "add chart".
Select the chart you want to create and click [Create Chart]:
You have now successfully created a chart with your own data.
For example:
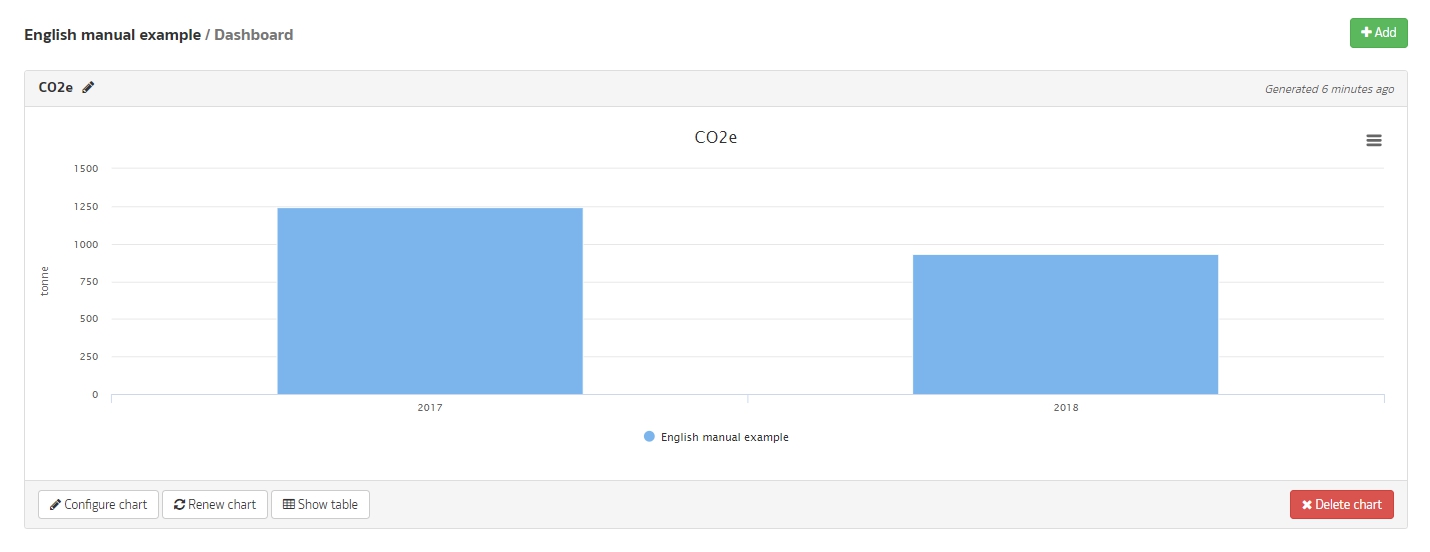
It is possible to configure the chart further by clicking on the [Configure chart] button in the right bottom of the chart. You can find more detailed information about charts in the Dashboard section of the manual.
0 Comments